Note
Click here to download the full example code
Plot Example to Learn Interface
Example to learn and gain experience
Out:
/Users/darilbrown/PycharmProjects/BirdSongToolbox/examples/plot_example.py:18: UserWarning: Matplotlib is currently using agg, which is a non-GUI backend, so cannot show the figure.
  plt.show()
import numpy as np
import matplotlib.pyplot as plt
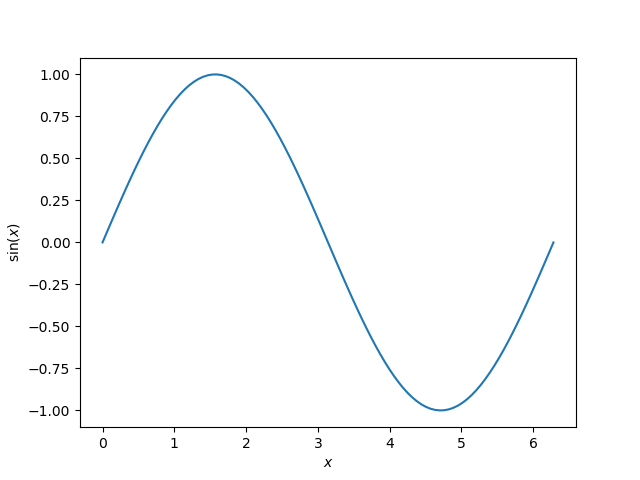
x = np.linspace(0, 2 * np.pi, 100)
y = np.sin(x)
plt.plot(x, y)
plt.xlabel('$x$')
plt.ylabel('$\sin(x)$')
# To avoid matplotlib text output
plt.show()
Total running time of the script: ( 0 minutes 0.304 seconds)